Summary
Percutaneous interventional techniques now include treatment of patients with not only coronary but also structural heart disease. To excel at today’s practice of interventional cardiology the operator must be constantly alert during and after the procedure to alterations of the patient’s clinical findings, electrocardiographic and haemodynamic status. A full understanding of basic haemodynamics and their pathophysiological alterations is required to address critical situations occurring during coronary interventions as well as clarify the diagnosis of and percutaneous treatment for valvular and other structural heart disease conditions. This chapter will review the fundamentals of cardiac haemodynamics, including those of the most common structural heart disease entities encountered in practice. Complete reviews of haemodynamics in general and those specifically applicable to more complex conditions can be found elsewhere [11. Kern MJ, Lim MJ, Goldstein JA (editors). Hemodynamic Rounds: Interpretation of Cardiac Pathophysiology from Pressure Waveform Analysis, 3rd ed. Hoboken (NJ): Wiley-Blackwell; 2009.
The interpretation of haemodynamic waveforms is critical to the understanding of cardiac pathophysiology.
This book provides detailed examples and explanations of the wide variety of pressure waveforms encountered in clinical practice., 22. Kern MJ, editor. The Cardiac Catheterization Handbook, 5th ed., Philadelphia (PA): Elsevier; 2010.
This book is the introduction text to performance of cardiac catheterisation and details the fundamental approach to the fi eld., 33. Baim DS. Grossman’s Cardiac Catheterization, Angiography, and Intervention, 7th ed. Philadelphia (PA): Lippincott Williams & Wilkins (LWW); 2006.
This book forms the in depth reading and understanding of cardiac catheterisation and interventions. The methods, pitfalls and techniques required for simple and complex studies are described., 44. Uretsky BF, editor. Cardiac catheterization: concepts, techniques and applications. Malden (MA): Blackwell Science; 1997.
Cardiac catheterisation methods are reviewed, annotated, and explained for the practicing cardiologist.].
Basic haemodynamics
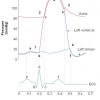
All pressure waves of the cardiac cycle can be understood by reviewing the electrical and mechanical activity of the heart as shown on Dr. Wigger’s diagram ( Figure 1 ). The timing of mechanical events, such as contraction and relaxation and the generation of transvalvular and ventricular pressure gradients is identified by their relationship to the ECG whose timing can be matched to the corresponding pressure waveform. Each electrical event (e.g., P wave, QRS, T wave) is followed normally by a mechanical function (either contraction or relaxation) resulting in a specific pressure wave. Each component of the ECG is responsible for a corresponding mechanical function. The ECG “P” wave is responsible for atrial contraction. The QRS triggers ventricular activation beginning the generation of LV pressure rise and ejection. The “T” wave is the signal for ventricular relaxation. The normal sequence of mechanical activity is disturbed by arrhythmias and conduction defects. Cardiac function may fail to generate sufficient forward output when arrhythmias limit cardiac filling or relaxation. Characteristic haemodynamic alterations to arrhythmias are often easily missed.
NORMAL PRESSURE WAVE FORMS
The cardiac cycle starts with the P wave which signals and initiates atrial contraction. Atrial systole and diastole are denoted as the “a’’ wave ( Figure 1, point #1) followed by the “x” descent, respectively. The P wave is followed by the QRS triggering depolarisation of the ventricles ( Figure 1 , point b). The LV pressure at the end of the “a” wave is called the end diastolic pressure and also known as LVEDP. The timing of this pressure point corresponds to the R wave (vertical line) intersection with the LV pressure ( Figure 1 , point b). About 15-30 milliseconds after the QRS, the ventricles contract, the LV (and RV) pressure increases rapidly during the isovolumetric contraction period ( Figure 1 , interval b-c). When LV pressure rises above aortic pressure, the aortic valve opens (point c). Systolic ejection continues until repolarisation, signalled by the “T” wave ( Figure 1 , point d). After the “T” wave, the LV relaxation produces a fall in the LV and aortic pressure. When the LV pressure falls below the aortic pressure, the aortic valve closes ( Figure 1 , point e). The ventricular pressure continues to fall and when it falls below the LA pressure, the mitral valve opens and the LA empties into the LV ( Figure 1 , point f).
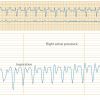
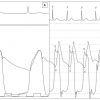
When one follows the atrial pressure wave across the cardiac cycle, atrial pressure during systole slowly rises with atrial filling at its maximal at the end of diastole. The atrial pressure continues to increase until LV isovolumetric relaxation when the pressure and volume of the LA are nearly maximal, producing a peaked ventricular filling wave, “v” wave. The “v” wave abates with a rapid fall, labelled the “y” descent occurring with mitral valve opening. The peaks and descents of the atrial pressure waves are changed by pathologic conditions and formed by the specific pressure-volume relationship of the chamber in which the pressure is measured. High compliance atria may produce small “a” and “v” waves despite a large amount of flow that may be present due to acute valvular regurgitation, heart failure, and infarction. Conversely, stiff low compliance chambers can produce exaggerated pressure waves with normal filling volumes. Figure 2 - Figure 4 illustrate several types of pressure waveform of the right and left heart.
INDICATIONS FOR RIGHT HEART CATHETERISATION (RHC)
RHC can differentiate causes of dyspnoea, pulmonary oedema (cardiac vs. non-cardiac) and pulmonary disease. RHC can assess the result of a trial of diuretic and/or vasodilator therapy. RHC can differentiate cardiogenic from noncardiogenic shock when intravascular volume expansion has failed. RHC guides therapy in patients with left-sided heart failure complicated by hypotension, oliguria, and/or renal failure and right-sided heart failure complicated by dyspnoea and/or hypoxaemia. RHC can establish pericardial tamponade when clinical assessment is inconclusive and echocardiography is unavailable or technically inadequate. RHC is useful in patients with pulmonary hypertension to gauge reversibility and vasoconstrictor tone for patients considered candidates for cardiac transplantation.
Contraindications of RHC include the routine management of pulmonary oedema, even if endotracheal intubation and mechanical ventilation have been necessary. RHC is also unnecessary or may delay treatment in patients with marked haemodynamic instability in whom pericardial tamponade is certain or probable by clinical and/or echocardiographic criteria.
LEFT HEART HAEMODYNAMICS
The aortic and pulmonary semilunar valve opens in systole with ventricular pressure normally matching aortic pressure. Descriptions of valvular haemodynamics will principally address the aortic and mitral valves as these are the most commonly affected. However, the mechanics of valvular disease are nearly identical for the right-sided heart valves but generally on a lower pressure scale. Stenosis of the semilunar valves produces obstruction to outflow, a systolic transvalvular pressure gradient and correspondingly high transvalvular flow velocity producing characteristic echocardiographic Doppler signals and systolic murmurs. The mitral and tricuspid (atrioventricular, A-V) valves are closed in systole when ventricular pressure is greater than atrial pressure. An atrioventricular valve that fails to close is characterised haemodynamically by a large regurgitant “v” wave and long but low flow velocity signals with rumbling systolic murmurs.
In diastole, incompetent semilunar valves fail to seal permitting a continuous backward blood flow into the ventricles with associated echocardiographic flow velocity findings and diastolic murmurs. For the A-V valves, atrial pressure and volume are highest early in diastole. The stenotic mitral valve has an early LA-LV pressure gradient with high flow velocity into the LV and a decrescendo diastolic rumbling murmur. The more severe the stenosis the higher is LA pressure and diastolic gradient, persisting across the entire diastolic period.
Basic haemodynamics and pressure wave interpretation The basic understanding of pressure waveforms in the heart will provide the foundation for appreciating alterations during coronary interventions
- Key points:
− From right heart haemodynamics, review and understand genesis of “a” and “v” waves in both the right atrial and left atrial pressure waveforms
− From left heart haemodynamics, appreciate the normal transvalvular pressure relationships and sequence of activation
− From the LV pressure waveform, identify diastolic left ventricular filling waveforms and those associated with pathologic conditions involving diastolic dysfunction and aortic valve regurgitation
METHODS FOR ACCURATE HAEMODYNAMIC DATA COLLECTION
To assess any haemodynamic condition accurately, the laboratory must establish setup routines and procedures to ensure accurate data collection. These routines include tight connections for both fluid filled tubing and electrical connections. To eliminate pressure artefacts, the operators and technicians should use optimal recording methods and the best fidelity catheter systems. The most common pressure wave artefact of a fluid-filled system is exaggerated resonance or “ringing” of an under damped pressure system ( Figure 4 , right side). The use of short stiff tubing, properly de-bubbled lines, and calibrated recordings are essential to minimise these artefacts. Correct interpretation of haemodynamic waveforms requires review of individual pressure waves and their timing to the ECG. It would not be unusual to have distorted pressure waveforms on the haemodynamic tracing due to an unappreciated electrocardiographic arrhythmia or conduction defect since often only one ECG lead is displayed for the operator.
Accurate hemodynamic assessment of aortic valve disease begins with good quality LV and aortic (Ao) pressures. Calculation of accurate valve areas requires precise transvalvular gradient and cardiac output measurements. Most routine measurements use the femoral artery pressure obtained through the side arm of an arterial sheath. FA pressure approximates but mostly overestimates central aortic pressure. Due to resonance and peripheral pressure amplification, the FA systolic pressure is higher than central aortic pressure. It is also delayed in time relative to central pressure. The delay and pressure amplification of the femoral artery artificially increases the mean LV-Ao gradient [55. Brogan WC, Lange RA, Hillis LD. Accuracy of various methods of measuring the transvalvular pressure gradient in aortic stenosis. Am Heart J. 1992;123:948-953.
Methods and pitfalls of obtaining accurate transvalular haemodynamics for the diagnosis of aortic stenosis are provided., 66. Folland ED, Parisi AF, Carbone C. Is peripheral arterial pressure a satisfactory substitute for ascending aortic pressure when measuring aortic valve gradients? J Am Coll Cardiol.1984;4:1207–12. ]. Figure 5 shows the LV-aortic pressure measured from a high fidelity catheter with micromanometer pressure transducers above and below the aortic valve compared to a fluid filled LV catheter with the fluid filled femoral artery sheath pressure. Note the delay and overshoot of the femoral pressure. When using femoral pressure, accurate gradients cannot be obtained in patients with peripheral vascular disease at the level of the aortic bifurcation or lower. For improved accuracy, a double lumen catheter or 2 arterial catheters are required [77. Percutaneous therapy for valvular heart disease: a huge advance and a huge challenge to do it right. Circulation. 2010;121:1798 -1799.
Review and description of new percutaneous methods for the treatment of valvular heart disease.].
Techniques to measure left ventricular-aortic pressure gradients from least to most accurate are shown on Table 1 .
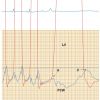
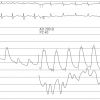
Specific questions often arise regarding the accuracy of the PCW pressure. Because this pressure is an indirect measure of the LA pressure transmitted through the pulmonary vein and pulmonary capillaries, there are several sources of potential error ( Figure 6). The PCW is commonly used to measure mitral valve gradients and is critically important for decisions regarding percutaneous therapeutic interventions like balloon valvuloplasty. A low PCW rarely is a function of artefact or pressure contamination. However, a high PCW can be falsely elevated due to the factors related to pulmonary pressure and incomplete wedging of the balloon as well as some degree of pulmonary vein stenosis or other pulmonary disease. A PCW with poor wave form or an elevated PCW in which there may be uncertainty regarding its clinical significance should prompt a confirmatory transseptal LA catheterisation.
There are two common methods to confirm an accurate PCW pressure that closely agrees with LA pressure. The operator should confirm that PCW pressure wave is not a damped PA pressure by identifying clear “a” and “v” waveforms timed against electrocardiogram (ECG) or LV pressure. An end-hole catheter measurement should be used for better PCW fidelity connected to the pressure transducer with stiff, short pressure tubing thoroughly flushed and bubble free. The operator should note the time delay (i.e., phase shift the PCW pressure “v” wave to match the LV down stroke). The PCW position (end-hole wedge with balloon deflated) is confirmed by an oxygen saturation > 95%. Common haemodynamic problems related to proper pressure recording techniques are reviewed in detail elsewhere [11. Kern MJ, Lim MJ, Goldstein JA (editors). Hemodynamic Rounds: Interpretation of Cardiac Pathophysiology from Pressure Waveform Analysis, 3rd ed. Hoboken (NJ): Wiley-Blackwell; 2009.
The interpretation of haemodynamic waveforms is critical to the understanding of cardiac pathophysiology.
This book provides detailed examples and explanations of the wide variety of pressure waveforms encountered in clinical practice., 22. Kern MJ, editor. The Cardiac Catheterization Handbook, 5th ed., Philadelphia (PA): Elsevier; 2010.
This book is the introduction text to performance of cardiac catheterisation and details the fundamental approach to the fi eld., 33. Baim DS. Grossman’s Cardiac Catheterization, Angiography, and Intervention, 7th ed. Philadelphia (PA): Lippincott Williams & Wilkins (LWW); 2006.
This book forms the in depth reading and understanding of cardiac catheterisation and interventions. The methods, pitfalls and techniques required for simple and complex studies are described., 44. Uretsky BF, editor. Cardiac catheterization: concepts, techniques and applications. Malden (MA): Blackwell Science; 1997.
Cardiac catheterisation methods are reviewed, annotated, and explained for the practicing cardiologist.].
Intracardiac shunts
ASD closures are now performed routinely in many labs by experienced operators. The haemodynamics of atrial pressures are used as indictors for the procedure but the degree of shunting in some patients makes the case for ASD closure. Since shunt determinations are important as an indication for the procedure, accurate calculations are needed [88. Gössl M, Rihal CS. Cardiac shunt calculations made easy: a case-based approach. Catheter Cardiovasc Interv. 2010;76:137–142.
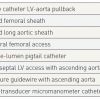
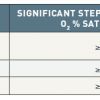
Methods of calculating cardiac shunts, explained in a simple and straightforward manner., 99. Kern MJ. Fick Simple-Shunt Hard: Simple Shunts Commentary. Catheter Cardiovasc Interv. 2010;76:143-4. ]. Shunt calculations use oxygen saturation samples obtained during a diagnostic “saturation run” obtaining blood from multiple locations ( Table 2) in a rapid, organised manner. A standard balloon-tipped Swan-Ganz–type catheter is satisfactory but a large-bore end-hole or side-hole catheter (multipurpose) catheter performs better rapid sampling. A left-to-right shunt is suggested when an oxygen step-up, or increase of oxygen content in a chamber or vessel exceeds that of a proximal compartment. A step-up in oxygen saturation at the PA by more than 7% above the RA saturation is indicative of a left-to-right shunt at the atrial level ( Table 3 ). Similarly, the desaturation of arterialised blood samples from the left heart chambers and aorta suggests a right-to-left shunt. In determining the site of the right-to-left shunt, sequential sampling can be made from the LA, LV, and aorta.
Mixed venous blood is assumed to be fully mixed PA blood. If there is a left-to-right shunt, mixed venous blood is measured one chamber proximal to the step-up. In the case of an atrial septal defect, the mixed venous oxygen content is computed from the weighted average of vena caval blood (i.e., as the sum of three times the SVC plus one IVC oxygen content and divided by four). When pulmonary venous blood is not collected, PVO2 (pulmonary vein) percentage saturation is assumed to be 95%.
SHUNT CALCULATION
The Fick or left-sided indicator dilution methods of CO determination are employed to measure systemic flow. Using the Fick method, the following formulae apply:
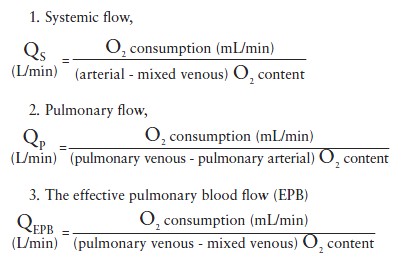
These formulae represent the original equations to determine shunt volume. In practice an abridged version is frequently used instead (  View chapter ). Normally the effective pulmonary blood flow is equal to the systemic blood flow. In a left-to-right shunt the effective pulmonary blood flow is increased (by the amount of the shunt) as follows:
QEPB= systemic flow + shunt flow, (left-to-right) (1)
In a right-to-left shunt, the effective pulmonary blood flow is decreased (by the amount of the shunt):
QEPB = systemic flow + shunt flow, (right-to-left) (2)
The shunt volume is determined by use of Equations (1) and (2).
The ratio of pulmonary to systemic flow (called Qp/Qs, where Q is flow, p is pulmonary, and s is systemic) for a left-to-right shunt is called the shunt fraction. ASDs with a Qp/Qs > 1.5 principally require closure.
LEFT AND RIGHT ATRIAL HAEMODYNAMICS
The LA pressure is always great than right atrial pressure after birth because of the differences in resistances of the two sides of the heart. The right atrium sees lower resistance of the pulmonary circuit compared to the left atrium which fills into a lower compliance systemic circuit. This relationship is evident in a patient with aortic stenosis in whom transseptal LA to RA pressure pullback was recorded showing large LA “v” waves compared to the lower RA pressure with much reduced “a” and “v” waves. However, during various times and especially during the Valsalva manoeuvre the RA pressure can increase above that of LA pressure and in the presence of a PFO produce right to left shunting and possible transit of emboli producing clinical sequalae. It should be recalled that PFO requires no special haemodynamic measurements.
Cardiac shunt calculations
• Cardiac shunt calculations require the determination of systemic flow, pulmonary flow and effective pulmonary blood flow
• With these three calculations, both left to right, right to left, and bidirectional shunting can be computed with facility
Diastolic dysfunction haemodynamics
PERICARDIAL DISEASE AND RESTRICTIVE CARDIOMYOPATHY
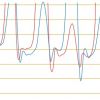
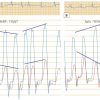
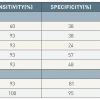
Ventricular chamber filling occurs in diastole. Impairment to ventricular filling is the result of diastolic dysfunction arising from a number of intrinsic and extrinsic causes. Intrinsic causes involve cardiomyopathies of hypertrophy, infiltrative diseases such as amylodosis or haemochromatosis and restrictive myopathic diseases. Extrinsic impairment to diastolic filling is most commonly due to pericardial constraint from pericarditis, cancer involving the pericardial space or tamponade. Diastolic dysfunction of pericardial constriction or myocardial restriction produces elevation and equalisation of right and left ventricular diastolic pressures with cessation of early ventricular filling ( Figure 7 ) classically described as a “dip and plateau”. These patterns of diastolic filling do not differentiate restrictive diseases from constrictive pericarditis. Traditional haemodynamic criteria for the diagnosis of constrictive pericarditis include end-diastolic pressure equalisation (left ventricular end-diastolic pressure minus right ventricular end-diastolic pressure > 5 mmHg), pulmonary artery pressure < 55 mmHg, right ventricular end-diastolic pressure divided by right ventricular systolic pressure > 1/3 dip and plateau diastolic pressure morphology as reflected by the height of the left ventricular rapid filling wave (> 7 mmHg), and Kussmaul’s sign (lack of an inspiratory fall in mean right atrial pressure) ( Table 4 ). Unfortunately, these criteria have been shown to be neither specific nor sensitive to differentiate the conditions.
Both restrictive diseases and constrictive pericarditis have impaired diastolic filling with elevated diastolic pressures that results in dyspnoea, oedema, fatigue, ascites, and other signs and symptoms of right heart failure. However, restrictive diseases have a decrease in ventricular chamber compliance (due to increased myocardial stiffness), which results in an abnormal increase in impedance throughout diastole and reduced atrial filling component at end diastole. In contrast, the ventricular chamber compliance is normal in early diastole in constrictive pericarditis. In mid-diastole, ventricular filling is abruptly decelerated as the intracardiac volume approaches the relatively fixed volume of the rigid constricting pericardium. The relatively fixed intracardiac volume results in an increase in ventricular interdependence, or ventricular coupling. The ventricles cannot fill independent of each other. The filling of one ventricle impairs the filling of the opposite ventricle. The constricting pericardium also produces a dissociation of the intrathoracic and intracardiac pressures. In other words, changes in intrathoracic pressure do not fully transmit through the diseased pericardium to the intracardiac structures. These differences in the physiology between restrictive diseases and constrictive pericarditis allow for accurate discrimination of constrictive pericarditis from restrictive cardiomyopathy ( Figure 8 ).
Cardiac tamponade
Fluid accumulating in the pericardial space produces an elevation of pericardial pressure. The magnitude of pericardial pressure depends on the rate of fluid accumulation and the compliance of the pericardium. Cardiac tamponade is the most severe form of diastolic dysfunction and is associated with compression of the heart and inability to fill due to pericardial pressure exceeding RA and RV diastolic pressure, reducing cardiac output, arterial pressure and ultimately resulting in death. Cardiac tamponade and constrictive pericarditis have important pathophysiological differences. Inspiration reduces intrathoracic pressure leading to a fall in pulmonary capillary wedge pressure. The pressure gradient driving blood flow into the left heart (i.e., the pulmonary capillary wedge pressure minus the intracardiac pressure is maintained at a nearly constant level throughout the respiratory cycle). In contrast, cardiac tamponade raises the intrapericardial and intracardiac pressures, resulting in an elevated pulmonary capillary wedge pressure. The inspiratory fall in intrathoracic pressure is unchanged and produces a similar fall in pulmonary capillary wedge pressure. The drop in pressure is not transmitted to the intrapericardial space or intracardiac chambers and the effective filling gradient is significantly reduced. These respiratory variations are not present in normal patients and resolve after pericardiocentesis. Dissociation of intrathoracic and intracardiac pressures also occurs in constrictive pericarditis, although the mechanism is from a rigid, thickened pericardium rather than a tense pericardial effusion ( Figure 9 ).
Diastolic dysfunction: haemodynamics- Characteristic findings of pericardial disease and restrictive cardiomyopathy are the most prominent forms of diastolic dysfunction
- The impairment of ventricular filling is common to both entities manifested as a diastolic “dip and plateau” configuration
- The most specific differentiating features of the 2 disease states involve the dynamic respiratory interaction of left and right ventricular systolic pressure
- Concordant respiratory systolic pressure changes are associated with restrictive cardiomyopathy whereas discordant respiratory pressure changes are associated with constrictive pericardial disease
Dynamic respiratory changes are the most sensitive and specific haemodynamics differentiating constrictive pericarditis from restrictive physiology. Hurrell et al [1010. Hurrell DG, Nishimura RA, Higano ST, Appleton CP, Danielson GK, Holmes DR Jr, Tajik AJ. Value of dynamic respiratory changes in left and right ventricular pressures for the diagnosis of constrictive pericarditis. Circulation. 1996;93:2007-13.
The most important haemodynamic advance in differentiating constrictive from restrictive cardiac physiology.
A must read for all cardiologists dealing with pericardial diseases from a haemodynamic standpoint.] examined dynamic respiratory changes in left and right ventricular pressures in 36 patients; 15 with surgically proven constrictive pericarditis and 21 with congestive heart failure. The dissociation of the intrathoracic and intracardiac pressures was assessed at end inspiration and end expiration by comparing the early diastolic pressure gradient between PCW and LVDP. The dissociation of intrathoracic and intracardiac pressures was significantly greater in those with constrictive pericarditis than restrictive diseases. During peak inspiration, there was an increase in right ventricular systolic pressure and decrease in left ventricular systolic pressure. In contrast, patients with congestive heart failure usually demonstrated concordant changes right and left ventricular systolic pressures during peak respiration, a finding that was 100% sensitive and 95% specific for the diagnosis of constrictive pericarditis ( Figure 10 ). The sensitivity, specificity, predictive positive and negative values are summarised in ( Table 4 ).
Conclusions
The haemodynamic waveforms are critical for understanding the pathophysiology of coronary and structural heart disease and serve as endpoint criteria for many of the interventions undertaken to address structural heart disease by the interventionist. Careful attention to these changes in pressure wave forms before, during and after interventions will assist the operators in producing optimal clinical outcomes.
Personal perspective – Morton J. Kern
The use of percutaneous interventional techniques, especially those involving structural heart disease, will require an understanding of both normal and pathophysiologic haemodynamic waveforms. An important starting point for the catheter based treatment of such disease conditions will be the appreciation of the severity and the type of pathology which generate these pathologic waveforms. Although the echocardiogram is the current haemodynamic standard for most structural heart disease, haemodynamic assessment is required when there is discordance between the clinical and echocardiographic findings. Uncertainty regarding specific entities or complex echocardiographic findings requires accuracy in haemodynamics to obtain a correct diagnosis. Inter-procedural haemodynamics will be of value to appreciate the endpoints of intervention or identify haemodynamic changes associated with a complication leading to adverse outcomes. It is the purpose of this chapter to explain and review the major right and left heart haemodynamic pressure waveforms which one may encounter for percutaneous interventional cardiovascular medicine.







It states here In constrictive pericarditis left ventricular end-diastolic pressure minus right ventricular end-diastolic pressure > 5 mmHg, shouldn’t it be
QEPB= systemic flow + shunt flow, (left-to-right) (1) In a right-to-left shunt, the effective pulmonary blood flow is decreased (by the amount of the shunt): QEPB = systemic flow + shunt flow, (right-to-left) (2) one of them should be minus isn't it?
as usual with Dr. Kern very precise and clear to the point. one phrase:When one follows the atrial pressure wave across the cardiac cycle, atrial pressure during systole slowly rises with atrial filling at its maximal at the end of diastole. was this supposed to be end systole?
very clearly