Summary
Haemodynamics are currently assessed by non-invasive Doppler echocardiography in most patients with structural heart disease. Thus, cardiac catheterisation is now performed principally in patients with complex haemodynamic challenges where questions remain after non-invasive testing. Current assessment of patients with structural heart disease in the catheterisation laboratory therefore requires a robust understanding of invasive haemodynamics and meticulous attention to performance of the procedure and interpretation of the results. This chapter reviews the current role, methods, and limitations of cardiac catheterisation for invasive haemodynamic evaluation.
Introduction
Cardiac catheterisation emerged in the 1960’s as the gold standard for the haemodynamic evaluation of valvular lesions and myocardial disorders. In the 1980’s, two-dimensional and Doppler echocardiography facilitated the non-invasive assessment of patients with structural heart disease through visualisation of valve morphology and ventricular remodelling, as well as measurements of transvalvular gradients, intracardiac pressures and cardiac output. Thus, invasive assessment with cardiac catheterisation is now indicated only when there is structural heart disease which cannot be assessed completely by the comprehensive echocardiogram. With the growing emergence of structural heart disease interventions, there is now a need to provide accurate assessment of haemodynamics before and after intervention.
The increasing complexity of patients coming to the catheterisation laboratory for haemodynamic assessment requires a robust understanding of the indications, methodology, and limitations of invasive catheterisation. There must be meticulous attention to detail when performing and interpreting the catheterisation. This chapter examines the role of invasive haemodynamic assessment in the evaluation of patients with valvular disease and hypertrophic cardiomyopathy where percutaneous intervention may be considered.
Aortic stenosis
 View chapter &
  View chapter
INDICATIONS
Degenerative aortic valvular stenosis is an active disease process that results from inflammation, lipid accumulation and calcification, leading to progressive obstruction and compensatory left ventricular (LV) changes [11. O’Brien KD, Reichenbach DD, Marcovina SM, Kuusisto J, Alpers CE, Otto CM. Apolipoproteins B, (a), and E accumulate in the morphologically early lesion of ‘degenerative’ valvular aortic stenosis. Arterioscler Thromb Vasc Biol. 1996;16:523-32. , 22. Olsson M, Thyberg J, Nilsson J. Presence of oxi- dized low density lipoprotein in nonrheumatic sten- otic aortic valves. Arterioscler Thromb Vasc Biol. 1999;19:1218-22. , 33. Rajamannan NM, Subramaniam M, Rickard D, Stock SR, Donovan J, Springett M, Orszulak T, Fullerton DA, Tajik AJ, Bonow RO, Spelsberg T. Human aortic valve calcification is associated with an osteoblast phenotype. Circulation. 2003;107:2181-4.
These three studies are seminal investigations which demonstrated that degenerative aortic stenosis is an active process of lipid accumulation, oxidation, chronic inflammation and calcification.]. With the ageing population, senile degenerative aortic stenosis has become increasingly prevalent as a valvular lesion requiring evaluation and therapeutic intervention. Two-dimensional and Doppler echocardiography can accurately assess the haemodynamic significance of aortic stenosis in the majority of patients. The gradient is derived from measuring the transvalvular velocity by continuous wave Doppler echocardiography and applying the modified Bernoulli equation:
Pressure gradient in mmHg = 4v2
where v = peak velocity in m/s. An aortic valve area can be calculated from the velocities across the aortic valve and LV outflow tract using the continuity equation.
Pitfalls in the echocardiographic assessment of aortic stenosis occur when the Doppler beam is not aligned properly with the direction of the aortic jet, usually resulting in an underestimation of the gradient. Overestimation of the gradient does not occur in the absence of severe anaemia or a high output state. Errors in the valve area are primarily due to problems with the measurement of the left ventricular outflow tract (LVOT) diameter and velocity. When there is a discrepancy in the severity of aortic stenosis between the clinical and echocardiographic findings in a symptomatic patient, cardiac catheterisation is indicated. Invasive haemodynamic evaluation for aortic stenosis should not be performed in patients without such a discrepancy, as there is a significant risk of cerebral embolism from retrograde crossing of the aortic valve. In patients who have features of severe aortic stenosis on physical examination, a calcified immobile aortic valve on echocardiography, and a high transvalvular Doppler mean gradient (>40 mmHg), invasive haemodynamics are not required.
METHODOLOGY
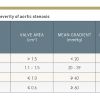
Assessment of the severity of aortic stenosis in the cardiac catheterisation laboratory requires accurate measurement of the transaortic gradient as well as cardiac output. The transaortic gradient is most accurate when the ascending aortic and LV pressures are measured simultaneously. These measurements are optimally obtained using either 1) two arterial accesses, or 2) a transseptal puncture for LV pressure and single arterial access for aortic pressure. A dual lumen pigtail catheter can be used for simultaneous LV and aortic pressure, but care must be taken to avoid damping of the aortic pressure due to the small lumen of the second aortic port. Electronically derived pressures from either an intracoronary pressure wire or a 2 Fr high fidelity manometer-tipped catheter placed into the left ventricle from an end-hole catheter in the aorta may also be used if meticulous attention is paid to ensure proper calibration. The mean gradient should be measured from at least 3 consecutive beats in patients with sinus rhythm or >8 to 10 consecutive beats in patients with irregular rhythms. The mean aortic valve gradient alone can be used for determining severity of aortic stenosis in the presence of a normal cardiac output ( Table 1 ).
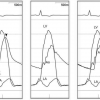
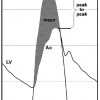
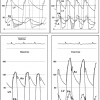
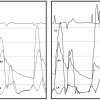
Peripheral pressures (e.g., sidearm of femoral sheath) should not be used as substitutes for central aortic pressure due to peripheral amplification and temporal delay, both of which can lead to errors in gradient measurement ( Figure 1 ). Pull-back of a single catheter from the LV to the aorta has been used to determine the peak-to-peak systolic gradient. This peak-to-peak gradient may approximate to the true mean aortic valve gradient in patients with large pressure gradients (>50 mmHg). However, the peak-to-peak gradient is not physiological, does not accurately reflect lower gradients, and may be erroneous in low output states or patients with irregular arrhythmia ( Figure 2 ).
Given the importance of cardiac output in valve area calculation, the operator should be aware of the limitations of the methods used to measure volumetric flow. Thermodilution output calculations may be erroneous in the presence of significant tricuspid regurgitation, bradycardia or tachycardia, or irregular rhythms. The Fick method for calculations of cardiac output requires measurements of arterial and venous saturations obtained only during a steady state, ideally with direct measurement of myocardial oxygen consumption (  View chapter ). An aortic valve area can be calculated from the transaortic gradient and cardiac output using the Gorlin equation [44. Gorlin R, Gorlin SG. Hydraulic formula for calcula- tion of the area of the stenotic mitral valve, other cardiac valves, and central circulatory shunts. I. Am Heart J. 1951;41:1-29.
The study by Gorlin and Gorlin led to the derivation of the formula used in the catheterisation laboratory for calculation of valve area from transvalvular flow rate and pressure gradient.]:

where ΔP is the mean transvalvular pressure gradient in mmHg and C is an empirical constant of 1.0 in aortic valve area calculations. Flow, represented by the numerator, refers to absolute forward flow across the valve, which is derived from cardiac output (CO) and systolic ejection period (SEP). Variability in valve area determinations using the Gorlin equation is ±0.2 cm2, but larger errors occur when there is significant bradycardia or tachycardia. Valvular regurgitation also leads to an underestimation of valve area, as the contribution of the regurgitant flow across the valve is not taken into consideration. A simplified version of the Gorlin equation was developed by Hakki and co-workers, who observed that the product of heart rate, forward flow, and the Gorlin constants approximated to 1 for most calculations [55. Hakki AH, Iskandrian AS, Bemis CE, Kimbiris D, Mintz GS, Segal BL, Brice C. A simplified valve formula for the calculation of stenotic cardiac valve areas. Circulation. 1981;63:1050-5.
Hakki and co-workers noted the product of heart rate, forward flow and the Gorlin constants approximated to 1 for most calculations, leading to a simplified ver- sion of the equation for valve area.]:


Both methods of calculating valve area are less accurate in patients with bradycardia, tachycardia, or low output states. A comprehensive evaluation of a patient with aortic stenosis should include measurement of the transaortic gradient, cardiac output, and calculation of valve area. The severity of stenosis is established when there is a concordance between the gradient and valve area ( Table 1 ). However, in situations where there is a discrepancy between the gradient and valve area, further information is necessary.
LOW-OUTPUT, LOW-GRADIENT AORTIC STENOSIS
A subset of patients with severe LV systolic dysfunction present with low cardiac output and low aortic gradient. In these patients, there will be a small calculated aortic valve area, but this may be due to 1) critical aortic stenosis, or 2) “pseudo-aortic stenosis”. The cause of the LV systolic dysfunction may be either severe critical aortic stenosis with long-standing pressure overload and progressive ventricular decompensation, or a primary myocardial process with only mild aortic stenosis. For the latter group of patients, the severity of the aortic stenosis is overestimated due to the flow-dependent nature of the Gorlin equation as well as insufficient opening of the aortic valve from decreased inotropy (i.e., pseudo-aortic stenosis). Differentiation of these two aetiologies is of paramount importance since it is only the patients with severe aortic stenosis who will benefit from aortic valve intervention.
The best studied method for differentiating between these two groups of patients with low-output, low-gradient aortic stenosis is dobutamine challenge [66. Nishimura RA, Grantham JA, Connolly HM, Schaff HV, Higano ST, Holmes DR Jr. Low-output, low- gradient aortic stenosis in patients with depressed left ventricular systolic function: the clinical utility of the dobutamine challenge in the catheterization laboratory. Circulation. 2002;106:809-13.
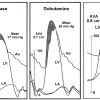
This investigation describes the methods for dobu- tamine challenge with detailed descriptions of the protocol and different haemodynamic responses, with implications for clinical management of patients with low-output, low-gradient aortic stenosis.]. At the time of catheterisation, dobutamine (starting at 5 μg/kg/min and gradually increasing to a maximum of 30 μg/kg/min) is infused to normalise cardiac output with continuous recording of the heart rate, blood pressure, and aortic gradient ( Figure 3 ). For patients who develop mean aortic valve gradients ≥40 mmHg, severe aortic stenosis is present. If the cardiac output normalises and the gradient remains low (<30 mmHg), “pseudo-severe” aortic stenosis is present. Finally, in some patients, there is no significant increase in cardiac output due to a lack of contractile reserve, which is defined as an increase in stroke volume of less than 20%. For this latter group of patients, there is a high perioperative mortality (33%) and poor long-term outcome following valve intervention, albeit better than medical therapy alone. Thus, while signifying poorer short and long-term survival, the absence of contractile reserve is not a contraindication to aortic valve replacement.
PARADOXICAL LOW-FLOW LOW GRADIENT AORTIC STENOSIS
Paradoxical low-flow low gradient (LFLG) occurs in ~5 % of patients with AS and is diagnosed if the patient meets all four of the following criteria: AVA ≤1 cm2 [with AVA indexed to BSA ≤0.6 cm2/m2], transvalvular mean pressure gradient ≤40 mmHg, with a stroke volume index <35 mL/m2 and LVEF ≥50 percent. In these patients, the low flow state is generally related to a small LV cavity with concentric LV hypertrophy associated with a restrictive mitral inflow pattern, elevated LV filling pressures, and dilated left atrium. The first step in management is to confirm that all non-invasive measurements and calculations for AVA, mean gradient, and LVEF are accurate. Cardiac catheterization is indicated to evaluate patients with suspected paradoxical LFLG AS when non-invasive tests are inconclusive or if there is a discrepancy between the clinical evaluation and the echocardiogram regarding severity of the valve lesion.
Haemodynamics of aortic stenosis
- Invasive haemodynamic evaluation of aortic stenosis is only indicated in symptomatic patients when there is a discrepancy between the clinical and echocardiographic or non-invasive findings, or when such findings is nondiagnostic.
- Aortic stenosis should be assessed in the catheterisation laboratory with simultaneous measurement of central aortic and left ventricular pressures for the mean gradient, and with calculation of cardiac output.
- Aortic regurgitation will lead to an underestimation of the valve area.
- Dobutamine challenge should be performed in symptomatic patients with low-output, low-gradient aortic stenosis to determine the true severity of the valve lesion.
- Hemodynamic cardiac catheterisation can be helpful to confirm the diagnosis of paradoxical LF-LG AS, especially when there is discrepancy between non-invasive tests and clinical findings.
Mitral stenosis
INDICATIONS
Mitral valve stenosis results from thickening of the valve leaflets, leading to immobility and obstruction of LV inflow. The predominant aetiology is rheumatic disease, although a history of rheumatic fever is elicited in only 50% to 70% of patients. Other aetiologies of LV inflow obstruction include congenital mitral stenosis, mitral annular calcification, and abnormal mitral prosthesis function due to pannus ingrowth, thrombus, or leaflet calcification.
Doppler echocardiography is a highly accurate and reliable method for measurement of the mean transmitral gradient [77. Aviles RJ, Nishimura RA, Pellikka PA, Andreen KM, Holmes DR Jr. Utility of stress Doppler echocardiography in patients undergoing percutaneous mitral balloon valvotomy. J Am Soc Echocardiogr. 2001;14:676-81.
This study illustrates the potential for symptom improvement with balloon valvuloplasty in patients who have low mitral gradients at rest and high gradi- ents during exercise Doppler echocardiography.]. Unlike aortic stenosis, the Doppler beam can be aligned with the direction of mitral inflow in virtually all patients with mitral stenosis, obviating a major potential limitation of Doppler echocardiography. Thus, Doppler echocardiography should be considered as the “gold standard” for calculation of transmitral gradients and as more accurate than cardiac catheterisation when the pulmonary artery wedge pressure is used. The calculation of valve area by Doppler echocardiography uses the concept of diastolic half-time, which measures the rate of fall of the transmitral pressure gradient. This parameter is dependent not only upon the severity of stenosis, but also upon other factors such as left atrial and LV compliance. Cardiac catheterisation for mitral stenosis is only indicated when there is a discrepancy between the clinical and echocardiographic findings, or discordance between non-invasive measures of gradient, valve area, and pulmonary pressures. The direct measurement of LV, left atrial, and pulmonary pressures may be helpful for further clinical decision making in these instances.
METHODOLOGY
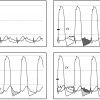
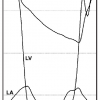
The conventional approach for assessing mitral stenosis in the cardiac catheterisation laboratory is to obtain a transmitral gradient using the pulmonary artery wedge pressure and LV pressure. However, it has been shown that this method results in an overestimation of the transmitral gradient by 30% to 50%. This error is due to both a temporal delay in the pulmonary wedge pressure as well as a dampening of the rate of diastolic pressure fall from transmission of the true left atrial pressure through the pulmonary arterial circulation. The resultant blunting of a y descent in the wedge pressure will result in an overestimation of the gradient even if the temporal delay is accounted for by “shifting” the wedge pressure ( Figure 4 ). Thus, for accurate assessment of the transmitral gradient, an LV pressure with a direct left atrial pressure, usually through a transseptal approach, should be used. The LV pressure can be measured by the passage of a balloon-tipped catheter through the left atrial sheath into the left ventricle or by a retrograde approach using a catheter with multiple side holes.
Although the pulmonary artery wedge pressure should not be used for direct measurement of the transmitral gradient, it does provide an excellent surrogate for the mean left atrial pressure. It is important to use a large-bore end-hole catheter, to ensure that the pressure is in the wedge position, and to confirm with an oxygen saturation >95%. For patients in whom there is a discrepancy between the Doppler haemodynamics and the clinical scenario, measurement of the pulmonary artery and wedge pressures by right heart catheterisation is useful. For instance, a patient may present with pulmonary hypertension as documented by non-invasive methodology, but have only a mild degree of mitral stenosis. A direct measurement of LV diastolic pressure, left atrial pressure (via pulmonary artery wedge pressure), and pulmonary pressure will determine whether or not the pulmonary hypertension is secondary to intrinsic pulmonary vascular disease, mitral inflow obstruction, or elevation of LV diastolic pressure from diastolic dysfunction. Pulmonary vein stenosis should be considered if there is a large gradient between the pulmonary wedge pressure and LV pressure that is out of proportion to the Doppler-derived mitral gradient.
Exercise haemodynamics are also helpful in clinical instances where symptomatology is out of proportion to resting haemodynamics. These studies can be done using exercise Doppler echocardiography for assessment of the mitral gradient and tricuspid velocity for pulmonary pressures, or in the cardiac catheterisation laboratory. For invasive studies, the optimal approach is supine bicycle exercise with right heart catheterisation performed from the internal jugular approach and an LV pressure obtained from a radial or brachial approach ( Figure 5 ). In these studies, a pulmonary artery wedge pressure that exceeds 20 mmHg during exercise indicates that symptoms are due to left-sided disease. The response of the LV diastolic pressure during exercise will differentiate symptoms due to mitral stenosis or those due to diastolic dysfunction.
Calculation of the valve area by cardiac catheterisation uses the Gorlin equation:

The diastolic filling period (DFP) is measured from closing to opening of the mitral valve. Normal mitral valve area ranges from 4.0 to 5.0 cm2. Severe mitral stenosis is defined as a transmitral gradient of > 5 - 10 mmHg (at a heart rate of 60-70 bpm) and valve area of ≤1.05 cm2. It is important to understand that the gradient is highly dependent upon the diastolic filling period so the heart rate must be taken into consideration when using the gradient to determine the severity of stenosis.
In patients with mitral stenosis, the rate of decay in the transmitral gradient is exponentially and inversely proportional to the severity of valve obstruction. Using this principle, diastolic pressure half-time is another invasive method for assessing mitral stenosis. The diastolic half-time is the time duration during which peak transmitral gradient decreases by 50% ( Figure 6 ). Because the rate of pressure decay is not dependent on transmitral flow, pressure half-time can be used reliably in patients with mitral regurgitation or irregular rhythms. Pressure half-time is also affected by abnormalities of ventricular or atrial compliance. It should not be used when there are acute changes in net atrioventricular compliance, specifically following mitral balloon valvotomy. Significant aortic regurgitation will also lead to abbreviation of the diastolic half-time.
Valvular regurgitation
INDICATIONS
The comprehensive assessment of a patient with valvular regurgitation requires definition of the aetiology and severity of the valve lesion, and determination of the ventricular response to volume overload. In many patients, two-dimensional echocardiography and Doppler echocardiography are able to provide the relevant information, obviating the need for an invasive cardiac catheterisation. However, there are limitations to echocardiographic assessment of the severity of valve regurgitation, which is based upon blood velocity changes rather than the volume. Cardiac catheterisation is indicated when there is a discrepancy between the clinical findings and severity of regurgitation on echocardiography.
PRESSURE WAVEFORMS
A complete assessment of regurgitant lesions by cardiac catheterisation requires measurement of upstream intracardiac pressures as well as contrast ventriculography or aortography. The severity of regurgitant lesions can be indirectly assessed through examination of the contours of the pressure waveforms at the time of cardiac catheterisation. Typically, patients with severe mitral regurgitation will have a large v wave in the left atrial pressure recording due to the rise in atrial pressure from systolic regurgitation. In addition, the height of the v wave is proportional to cardiac output and systemic resistance, and inversely related to compliance of the left atrium. Thus, a large V wave is consistent with, but not diagnostic of, mitral regurgitation. In patients with tricuspid regurgitation, the right atrial pressure is elevated with early rapid right ventricular filling, accentuation of the V wave and blunting of the x descent, leading to a “CV” waveform ( Figure 7 ). In severe cases, the right atrial waveform may resemble the right ventricular tracing due to rapid equalisation of pressures.
For patients with severe aortic regurgitation, there is a steeper descent in the aortic diastolic waveform along with a rapid rise in LV diastolic pressure, particularly when ventricular decompensation is present ( Figure 8 ). Chronic severe aortic regurgitation usually results in a widened aortic pulse pressure, which may not be evident in acute cases of regurgitation. In acute cases of paravalvular aortic regurgitation after transcatheter aortic valve replacement, an index for severity of the regurgitation has been proposed and validated in several studies. It is calculated as ratio of the gradient between diastolic blood pressure (DBP) and left ventricular end-diastolic pressure (LVEDP) to systolic blood pressure (SBP): [(DBP - LVEDP)/SBP] x 100. Sinning et. al. demonstrated that this index decreased stepwise in parallel with increasing severity of peraivalvular AR and was a powerful predictor of 1-year mortality after TAVR, —independent of the degree of echocardiography estimated perivalvular AR estimated with echocardiography [88. Sinning JM, Hammerstingl C, Vasa-Nicotera M, Adenauer V, Lema Cachiguango SJ, Scheer AC, Hausen S, Sedaghat A, Ghanem A, Müller C, Grube E, Nickenig G, Werner N. Aortic regurgitation index defines severity of peri-prosthetic regurgitation and predicts outcome in patients after transcatheter aortic valve implantation. J Am Coll Cardiol. 2012 Mar 27;59(13):1134-41.
This study provides a simple, reproducible assessment of peri-prosthetic aortic regurgitation during transcatheter aortic valve implantation (TAVI) and its prognostic impact on 1-year mortality.].
ANGIOGRAPHY
The severity of valvular regurgitation can be determined through injection of contrast into the chamber or great vessel immediately distal to the regurgitant valve. Angiography should be performed using large-bore catheters with side holes to reduce catheter whip, and preferably with biplane imaging to obtain multiple views. The degree of contrast opacification of the receiving chamber is not only related to the severity of regurgitation, but is also dependent on the amount of contrast, rate of injection, ventricular function, and size of the cardiac chambers. Typically, contrast volume and injection rates are 50 to 60 ml at 20 ml/sec for aortic regurgitation, and 40 to 50 ml at 12 to 15 ml/sec for mitral or tricuspid regurgitation.
For evaluation of mitral regurgitation, the right anterior oblique projection should be set up to minimise overlap of the left atrium and descending aorta. Thus, the right anterior oblique angle may need to be increased to >40 degrees. During contrast injection, it is crucially important to avoid ventricular ectopy, which causes acute changes in ventricular load and contractility and therefore precludes accurate assessment of mitral regurgitation. Ventricular ectopy can be avoided by placing the pigtail catheter at the base of the heart with rotation away from the ventricular septum, and by testing of the catheter position and contrast injection during deep inspiration.
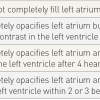
Sellers’ criteria are a semi-quantitative method for assessing the severity of mitral regurgitation ( Table 2 ) [99. Sellers RD, Levy MJ, Amplatz K, Lillehei CW. Left retrograde cardioangiography in acquired cardiac disease: technic, indications, and interpretations in 700 cases. Am J Cardiol. 1964;14:437-47.
In this study Sellers and co-workers describe the stand- ard methodology for semi-quantitation of valvular regurgitation with angiography.]. Although there are limitations to this method, these criteria have served as the basis for surgical therapy and are routinely examined in current outcome studies of patients with valvular regurgitation. Similarly, Sellers’ angiographic method can be applied in patients with aortic and tricuspid valve regurgitation.
Angiography in valve regurgitation
- Angiography for valvular regurgitation is indicated in symptomatic patients when there is a discrepancy between the clinical findings and severity of regurgitation on echocardiography.
- Sellers’ criteria are the semi-quantitative method for assessing the severity of valvular regurgitation.
Hypertrophic cardiomyopathy
 View chapter
INDICATIONS
Hypertrophic cardiomyopathy (HCM) is an inheritable cardiac disorder with a prevalence of 1 in 500 persons. HCM is defined as severe myocardial hypertrophy in the absence of secondary aetiology. Thus far, over 400 disease-associated mutations in at least 12 different sarcomeric genes have been identified. Two-dimensional echocardiography readily leads to the diagnosis of HCM in suspected patients. A left ventricular outflow tract gradient (LVOT) is frequently present, especially in symptomatic patients. Although controversy exists as to whether the gradient represents true “obstruction”, it is well documented that therapies which reduce or abolish this gradient will improve symptoms. In the vast majority of cases, Doppler echocardiography detects and accurately quantifies the severity of LVOT gradient using the modified Bernoulli equation:
Gradient in mmHg = 4v2
Cardiac catheterisation is indicated in HCM when there is uncertainty regarding the presence and severity of LVOT gradient based upon the non-invasive evaluation. This may occur when there is contamination of the LVOT signal from mitral regurgitation, which can lead to spurious estimates of the LVOT gradient. Systolic cavity obliteration, which can cause high intracardiac velocities, can occur in the absence of a true LVOT gradient. Thus, cardiac catheterisation would be necessary when no significant systolic murmur is heard on clinical examination and yet there is a high systolic velocity by Doppler echocardiography. In addition, the LVOT gradient in patients with HCM may be labile and not necessarily present at non-invasive testing. For symptomatic patients without significant LVOT gradients at rest, cardiac catheterisation with provocative manoeuvres can be performed to detect latent LVOT gradients. Echocardiography is limited in its ability to assess diastolic function, which should be examined with direct pressure measurement of pulmonary artery wedge pressure or left atrial pressure when this information is needed in HCM. Finally, patients with multiple levels of LVOT gradients (e.g., aortic stenosis and dynamic subaortic obstruction) require catheterisation to examine the relative contributions of each level of gradient.
METHODOLOGY
Assessment of the LVOT gradient should be performed with simultaneous measurement of LV and ascending aortic pressures. The best technique to obtain LV pressure is through transseptal puncture with placement of the LV catheter at the mitral inflow region. This method avoids ventricular entrapment, which is common using a retrograde aortic approach ( Figure 9 and Figure 10 ). If a retroaortic approach is used it is important to avoid the use of pigtail catheters with multiple side holes and to check for entrapment. Avoidance of entrapment can be demonstrated by disconnecting the catheter and showing pulsatile flow, as well as hand contrast injections to show the catheter moving freely within the LV cavity.
PATHOPHYSIOLOGY
Diastolic dysfunction is the major pathophysiological consequence of HCM, arising from altered ventricular loading conditions, ventricular non-uniformity, myocardial ischaemia, and increased muscle stiffness. Measurement of the operative compliance requires simultaneous measurement of volume and pressure, and true myocardial stiffness necessitates obtaining instantaneous stress-strain relationships. The impairment in myocardial relaxation can be measured by the time constant of relaxation (tau) by fitting a mono- or bi-exponential curve to the LV pressure during isovolumic relaxation period.
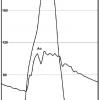
The LV and aortic pressures have specific contours in HCM patients with dynamic outflow tract gradients. The ascending aortic pressure will have a typical “spike-and-dome” pattern and the LV pressure will show an asymmetric rapid increase during mid to late systole. These contours reflect the late systolic gradient, which is most commonly related to secondary systolic anterior motion of the mitral valve. In patients with fixed obstruction, there will be a slow upstroke (tardus) of the aortic pressure with a symmetric contour in the LV tracing ( Figure 11 ).
Dynamic LVOT gradients occur in one third of HCM patients at rest, but in up to two-thirds of patients with provocative manoeuvres [1010. Maron MS, Olivotto I, Zenovich AG, Link MS, Pandian NG, Kuvin JT, Nistri S, Cecchi F, Udelson JE, Maron BJ. Hypertrophic cardiomyopathy is predominantly a disease of left ventricular outflow tract obstruction. Circulation. 2006;114:2232-9.
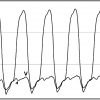
This study examined patients with hypertrophic cardio- myopathy using exercise echocardiography, and demonstrates the high prevalence of left ventricular outflow tract obstruction in these patients. The study illustrates the dynamic nature of left ventricular outflow tract obstruction, the detection of which frequently requires examination with provocative manœuvres.]. Importantly, the presence of the LVOT gradient is exquisitely sensitive to ventricular load and contractility. Variation in the LVOT gradient may be present in some patients during respiration due to changes in LV afterload caused by changes in intrathoracic pressures ( Figure 12 ). Since treatment with septal reduction therapy should only be performed in patients with LVOT gradients >50 mmHg, provocative manoeuvres should be performed in symptomatic patients with smaller or no gradients. The strain phase of the Valsalva manoeuvre is a commonly used manoeuvre in the cardiac catheterisation laboratory. Examination of the LV and aortic pressures after a premature ventricular contraction (PVC) can also be used. On the post-PVC beat, the aortic pulse pressure will decrease due to the marked increase in myocardial contractility and worsening of LVOT obstruction (i.e., Brockenbrough response) ( Figure 11 ). This helps to differentiate from a fixed obstruction in which there is an increase in pulse pressure on the beat after a PVC. Isoproterenol is the optimal drug for provocation due to its b1 and b2 agonist activity, which leads to augmentation of myocardial contractility and peripheral vasodilatation ( Figure 13 ). During isoproterenol infusion (1-10 mcg/min), adjunctive echocardiography is performed to examine for systolic anterior motion of the mitral valve.
Haemodynamics in hypertrophic cardiomyopathy
- Invasive haemodynamic evaluation is indicated in symptomatic HCM patients when there is uncertainty regarding the presence or severity of the LVOT gradient.
- The best method for assessing the LVOT gradient in HCM is transseptal puncture to avoid ventricular entrapment.
- On the post-ectopic beat in HCM, the hallmark haemodynamic findings of dynamic LVOT obstruction are a decrease in the aortic pulse pressure with exaggeration of the “spike-and-dome” configuration.
- Provocative manoeuvres, such as Valsalva strain and isoproterenol administration, should be performed to detect the presence of latent LVOT obstruction.
Personal perspective - Paul Sorajja
Modern insight into the pathophysiology of the heart and circulatory system first emerged through comprehensive invasive hemodynamic studies performed in the cardiac catheterization laboratory. The principal advantage of the invasive hemodynamic studies is the ability to directly measure pressure and flow in multiple chambers simultaneously, both in the resting and dynamic state.
With the advances in imaging technology, noninvasive investigations are now routinely used for assessment of patients with cardiac diseases. However, given the inherent limitations of the imaging tests, invasive hemodynamic assessment remains the "gold standard" technique, particularly in situations where noninvasive evaluation is inconclusive or discordant with clinical findings.
Furthermore, in the last several years, the field of structural heart interventions has evolved tremendously which led to resurgence of interest in the accurate assessment of haemodynamics for those patients with complex cardiac diseases. Therefore, a properly performed invasive haemodynamic evaluation remains an integral part of the management of these patients, and every operator should be trained to master the cognitive and technical skills to perform these studies.


